|
Once
alternative probesets have been identified from
an AltAnalyze exon array analysis, you can easily
load this data in the Cytoscape plugin DomainGraph
to:
|
1)
|
Visualize
interaction networks between proteins and
specific protein domains. |
|
2) |
Assess
which probesets overlap with a set of loaded
genes and which specific protein domains at
a high-level (protein/domain network) and
low-level (domain/exon/probeset view). |
|
3) |
Immediately
see which probesets overlap with known/predicted
alternative splicing events, alternative promoter
selection or microRNA binding sites. |
| |
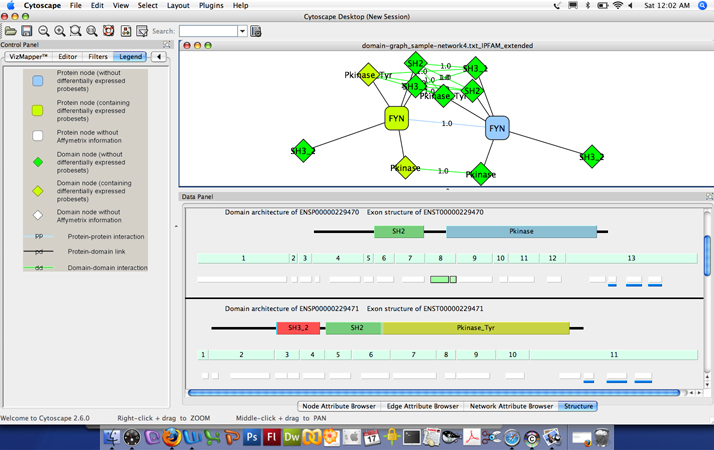
Figure
1: Visualization of AltAnalyze regulated probests
along exons and protein domains. In the
top pannel, a loaded Cytoscape DomainGraph
network is shown for the gene FYN, with relavent
protein domain interactions shown between
two alternative isoforms of each gene. Rounded
boxes represent gene nodes and diamonds, protein
domains and other functional elements. Greenish
yellow nodes represent those containing AltAnalyze
regulated probesets, whereas green do not
overlap with an AltAnalyze regulated probeset.
The gene FYN has been selected in the main
network which creates a domain architecture
and exon strucuture view for the select FYN
isoform in the Cytoscape "Data Panel". Domains
(top), exons (middle) and probesets (bottom)
are shown that correspnd to the FYN isoforms
ENSP00000229470 and ENSP00000229471, with
AltAnalyze down-regulated probesets in green.
Probesets with a solid black border are associated
with alternative splicing (alternative cassette
exon) in this example, overlaping with exon
8 and the Protein Kinase domain of the protein.
Probesets with a blue bar beneath them overlap
with predicted microRNA binding sites. Details
about each domain, exon, probeset and microRNA
binding site, including AltAnalyze statistics
and functional annotaitons are accessible
by mousing-over the respective feature and
by left-clicking the object to link-out to
resources on the web. |
Installing
DomainGraph
| |
1)
|
Prior
to installing DomainGraph, goto http://www.cytoscape.org
and download the latest version of Cytoscape.
|
| |
2) |
DomainGraph,
like most other Cytoscape plugins, can be
downloaded within Cytoscape, after installation
by choosing the Plugins>Manage Plugins>Network
Inference menu. DomainGraph will be listed
under the "Available for Install" plugins.
If you believe this plugin is outdated or
you wish to access additional information
on DomainGraph, goto http://domaingraph.bioinf.mpi-inf.mpg.de/ |
| |
3) |
After
installation, goto the menu Plugins>DomainGraph>ManageGaph
database>Import data for selected species
into database |
| |
4) |
Next,
you will be asked to register your installation
of DomainGraph (DomainGraph is currently free
ONLY for non-comercial use). After filling
out the form, choose to accept the user agreement
and select OK. You will recieve a registration
key by email. |
| |
5) |
Enter
the registration key into the bottom of the
registration form you filled out. If closed,
you can access this again by performing step
3. |
| |
6) |
Repeat
step 3 and download the DomainGraph database
for your species. AltAnalyze currently supports
mouse and human analyses. Database download
can take several minutes. |
| |
7) |
Once
finished, you are ready to import a gene network
and AltAnalyze results. |
Running
AltAnalyze
DomainGraph analyses are compatible with data
from Affymetrix Exon 1.0 arrays. To get AltAnalyze
results, you must be analyzing data from this
array platform. First, make sure that you have
all of your microarray .CEL files or probeset
expression values. Next, download AltAnalyze from
the AltAnalyze
website. Full directions on running AltAnalyze
can be found in the online AltAnalyze
Help or by following AltAnalyze
tutorial. Of the several result files created
by AltAnalyze for every pairwise comparison (experimental
group compared to a control group of arrays),
the domaingraph output file in the AltResults/DomainGraph
folder needs to be selected when starting DomainGraph.
Importing AltAnalyze Results
and Visualizing Data
A sample AltAnalyze DomainGraph input file can be found here that corresponds to a GEO dataset of PTB knockdown. Other AltAnalyze results for this dataset can be found here.
For the most up-to-date instructions on using
AltAnalyze results in DomainGraph, click here or here.
If you have any other questions you can email
us at: alt_predictions@googlegroups.com
or
nsalomonis@gmail.com
|